Central Chiller Plant Designs and Design Options – Are We Leading or Bleeding?
For engineers, how many codes, metrics, and standards are too many?

I have struggled with writing this article based upon what is being reported and what our industry leaders are recommending. It’s a fine balancing act, and I feel we may have too many plates spinning at once. Even terminology definitions can be difficult to agree upon. Terms like, “Above Grade Wall,” “Gross Building Area,” “EUI,” and even “Standard Air” have differing definitions depending on their intended use, application, or the trade society or group using them. A friend of mine once said, “A difference isn’t a difference unless it makes a difference.” So, what differences are your HVAC designs making? Are they leading or bleeding?
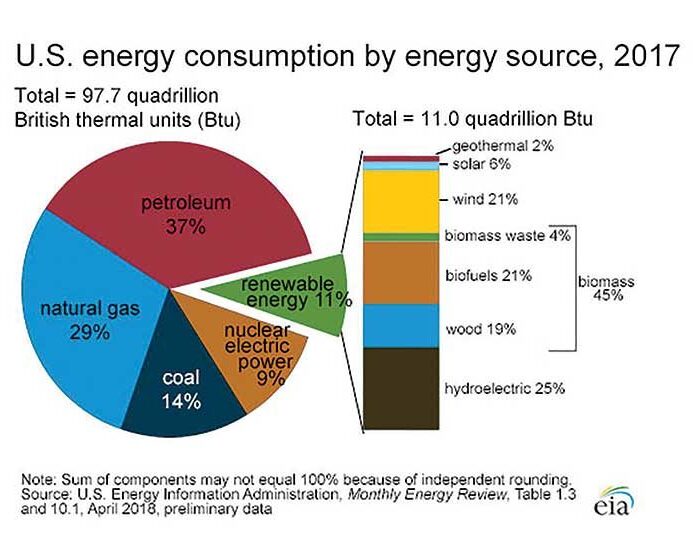
Figure 1: Energy Consumption by source 2017.5
The Bipartisan Budget Act of 2019 (H.R. 3877), recently passed by the House, seems to prove quite contrary to its name. The legislation proposes to add nearly $2 trillion to the federal debt over the next 10 years. The two-year agreement will raise spending caps to $320 billion above previous levels and suspends the debt ceiling for two years, passing the next round of negations until after the 2020 election. The legislation also averts mandatory spending cuts stemming from the Budget Control Act of 2011 that would have gone into effect Sept. 30. Does our engineering follow this model of ignoring facts and kicking the can down the road?
ASHRAE was formed as the American Society of Heating, Refrigerating and Air-Conditioning Engineers by the 1959 merger of American Society of Heating and Air-Conditioning Engineers (ASHAE), founded in 1894, and the American Society of Refrigerating Engineers (ASRE), founded in 1904. ASHRAE has been expanding and assisting the world with system designs through guidelines and standards.
Our industry has created all kinds of rating systems, terms, and factors to consider when designing energy-efficient systems. The inaugural World Refrigeration Day took place on June 26 of this year. This day was established in 2018 to serve as a means of raising awareness and understanding to the general public regarding the significant role refrigeration and refrigerants play in modern life and society.
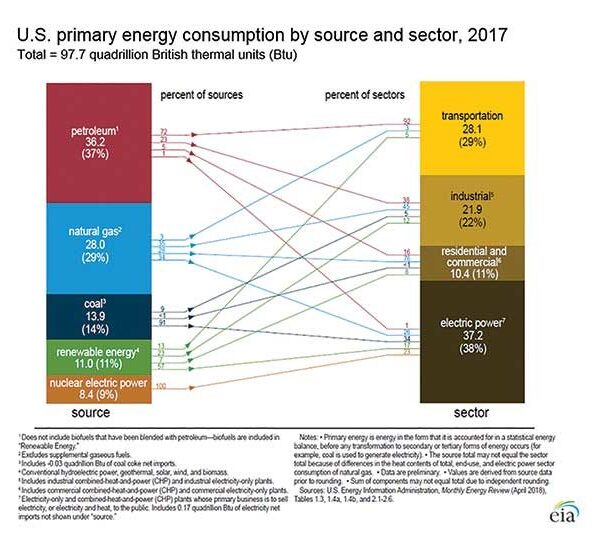
Figure 2: Energy Consumption by source and sector 2017.5
The Montreal Protocol was first adopted Sept. 16, 1987. Its objective is to protect human health and the environment by phasing out nearly 100 industrial chemicals that contribute to climate change because they are known as ozone depleting substances. OzonAction is a branch of the United Nations Environment Programme as part of its Division of Technology, Industry, and Economics. Since June 19, 1991, it has been strengthening the capacity of governments and industry in developing countries to elaborate and enforce the policies required to implement the Montreal Protocol and make informed decisions about alternative technologies. The overall goal is to enable those countries to meet and sustain their compliance obligations under the treaty.1
The U.S. Environmental Protection Agency’s (EPA’s) Significant New Alternatives Policy (SNAP) program implements section 612 of the amended Clean Air Act of 1990, which requires the EPA to evaluate substitutes for specific ozone depleting substances in an effort to reduce the overall risk to human health and the environment. Through these evaluations, SNAP generates lists of acceptable and unacceptable substitutes for each of the major industrial use sectors. The intended effect of the SNAP program is to promote a smooth transition to safer alternatives2; however, SNAP has significantly slowed its new rules and changes to rules in the last three years. The latest change considered flammable refrigerants for refrigerators and small volume sealed systems.
Total Equivalent Warming Impact (TEWI) is a measure of the global warming impact of equipment based on the total related emissions of greenhouse gases during the operation of the equipment and the disposal of the operating fluids at the end of its life. TEWI considers both direct fugitive emissions and indirect emissions produced through the energy consumed in operating the equipment. TEWI is measured in units of mass in kg of carbon dioxide equivalent (CO2-e). Additionally, TEWI is a methodology for computing the total relevant emissions of greenhouse gases for specific applications — in this case, refrigeration and air conditioning. It’s important to note that the largest impact of global warming from stationary refrigeration and air conditioning is through electricity generation to power the equipment.3 I assume this guide replaces or enhances the National Greenhouse and Energy Reporting Act of 2007, another Australian guideline.4
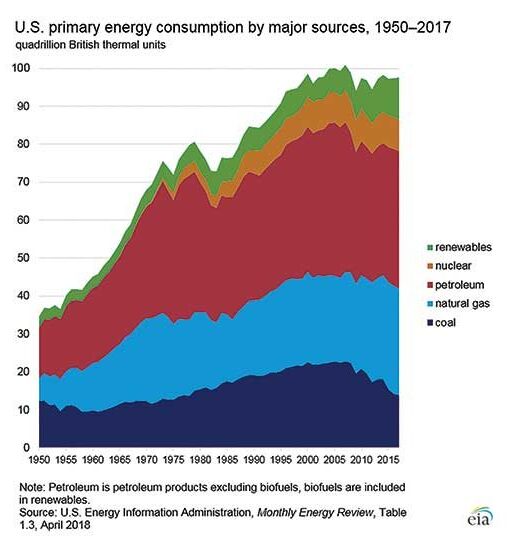
Figure 3: Primary energy consumption by source history.5
Energy calculations are dependent on a number of assumptions about equipment performance and use patterns, refrigerant properties, and electricity generation efficiency. Do I use the average emissions from electrical plants of my state or only the plant nearest the site? Can I select a more efficient electrical site? The internet, today, was unable to tell me the emission rates or efficiency of any nearby electrical plants. So, making source-based decisions is challenging.
McClure Engineering may not be able to control or influence the emissions at the nearest energy source; however, we do have the ability to influence or dictate energy use on-site. Our design for the HVAC system can include the following:
- Energy recovery from exhaust air to ventilation air in HVAC equipment.
- High-efficiency, condensing boilers with high delta-T coils to increase heat transfer.
- A high-efficiency, central chilled water plant that can take advantage of building use diversity.
- Variable volume HVAC units and pumps to serve the facility and operate at reduced speeds throughout most of their operating period.
- An ‘extra’ coil in a few specific HVAC units to operate on return chilled water to precool air in high ventilation periods and improve overall chilled water plant efficiency.
- Higher R value duct insulation to reduce energy losses.
Our design could even include a geothermal source central heat pump for part of the heating and cooling needs of the facility. A geothermal source central heat pump can provide both heating water and chilled water for conditioning the facility throughout the year. An optimal geothermal well field for a particular project would provide 25-33% of the central plant capacity and would require a geothermal field of 60 wells in a 5-by-12 matrix covering an area of about 80-by-220 feet (wells spaced 20 feet apart). The well field was designed with five loops of 12 wells in a reverse return arrangement. The premium cost of the installation was estimated to be about $480,000 and would save at least $23,000 per year. This would offer a straight-line payback of roughly 20.8 years. The heat pump chiller could be installed on the load side of the chilled water plant bypass so that the heat pump is base-loaded to operate at maximum efficiency and provide consistent heating water. The actual performance is likely better than the economics presented. When this project bid, the geothermal system was an alternate, and the alternate bids came in at a range of $603,000-$1.15 million. Unfortunately, the highest bid for this alternate was tied to the lowest bid for the balance of the project, and the owner did not accept the alternate for the geothermal heat pump system. Electric rates in the Midwest are low compared to the rest of the U.S., and influencing an owner to commit to this investment was a challenge that I could not overcome.
Considerations for condensate collection from air-handling units for reuse in cooling tower make-up water was also considered but found not to be cost-effective.
In another design, McClure Engineering considered a chiller plant based on the TEWI of ammonia versus R514A. R-514A is a blend of hydrofluoroolefin (HFO) 1336mzz(Z) (74.7%) with trans-1,2-dichloroethene (25.3%), a nonflammable “B1” refrigerant, and occupational exposure limit (OEL) of 323 ppm. The R-514A chiller had a full-load rating of 0.552 kW/ton (hourly energy use of 231.84 kW), whereas the ammonia chiller had a full-load rating of 0.643 kW/ton (hourly energy use of 270.06 kW). This additional energy use equates to 51 hours of full-time run hours in between complete discharges in order to have the same global warming impact (using a source electric emission rate of 1.788 pounds CO2 per kWH). Considering the low GWP (2) of R-514A and the low probability of it winding up in the atmosphere. If you’re making chiller selection decisions based only on refrigerant GWP, you’re looking at the wrong parameter. The chiller efficiency has a much larger impact on climate over the life of the equipment, even though this difference appears to be small (1.5%). TEWI would be a better measure for comparison.
With careful study, engineers can evaluate options in system design, equipment selection, and system operation and assist owners in making energy-efficient and climate-conscience decisions. Engineers need to take a more proactive role in forming these guidelines and standards. We also need to make sure we are all pulling in the same direction.
The 25th IIR International Congress of Refrigeration took place in Montreal on Aug. 24-30. I encourage you to review the recommendations from some of the finest engineers in the world who attended that meeting to see what our future holds.
Footnotes
4 National Greenhouse and Energy Reporting Technical Guidelines

Chuck Dale-Derks, P.E.
Published September 20, 2019 in Engineered Systems
Chuck Dale-Derks, P.E., is a principal at McClure Engineering, a mechanical and electrical consulting engineering firm dedicated to the development of innovative solutions to unique engineering problems.


